Who’s afraid of the inverted yield curve?
The financial press has been worrying about the yield curve[1] recently. The yield curve is “flattening,”[2] and that flattening “raises a warning flag.”[3] If you read the articles, you’ll see that the authors are most concerned about the possibility that the yield curve may become “inverted.”
This raises several questions:
- What is the yield curve?
- What does it mean to say the yield curve is inverted?
- Why does it matter whether the yield curve is inverted?
- Should you be worried about an inverted yield curve?
What is the yield curve?
The yield curve is a fixed income concept, and the financial press is writing about the yield curve for US Treasury securities. US Treasury securities come in different maturities, from four weeks (called bills, because interest is paid at maturity) to 30 years (bonds, as interest is paid semi-annually). Each maturity has its own interest rate and yield.
The interest rate is the return that buyers of the security at face value (or par) receive. The yield is the return that buyers at the market price receive. For example, someone who buys a $100 one-year 4% Treasury bill at face value would receive $104 at maturity, for a return of 4%. If market interest rates rise the next day,[4] causing the market price to drop to $99.05, a new buyer will still receive $104 at maturity, but the yield would be 5%.[5]
Graphing each Treasury security’s yield against its maturity, we get a yield curve, as in the chart below.
Immediately, we notice:
- The curve slopes up
- It is hard to describe the curve simply:
- The slope is steeper from 1 month to 1 year
- The slope is shallower from 1 year to 3 years
- Then it’s steeper again, then shallower
That complexity doesn’t lend itself well to soundbites (or to analysis either, by the way). So, a simple convention has emerged. When the media talk about the yield curve, they usually mean the difference between the 10-year yield and the 2-year yield.[6] That compares just two numbers – easy to calculate, easy to visualize, and easy to analyze.
What does it mean to say the yield curve is inverted?
Let’s start by looking at why the yield curve usually slopes up.
Suppose that we knew that 1-year interest rates and yields were going to stay the same for the next 30 years, say at 3%. We could hold a sequence of 30 1-year bonds at 3%, or one 30-year bond at 3%, and be equally well off. Either way, we’d receive 3% per year on our investment for the next 30 years.
In the same way, if we knew that rates were going to alternate between 3% and 4% every year for the next 30 years, a 30-year bond at 3.5% would be equivalent to holding a sequence of 30 1-year bonds. The general principle is that if we know the sequence of future yields, the 30-year yield is the average of the 30 1-year yields. So, if future 1-year rates were known to be stable, the yield curve would be flat. If future 1-year rates were known to be increasing, the yield curve would slope upward, and if future 1-year rates were known to be decreasing, the yield curve would slope down.
However, future 1-year yields are unknown. Holders of bonds with longer maturities are subject to interest rate risk because future rates will differ from those expected today. If interest rates rise, the sequence of coupon payments and the final return of principle will be worth less (could be purchased for less) than they paid.
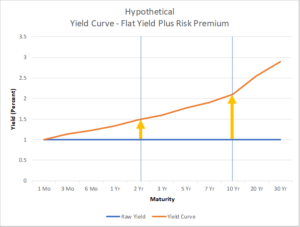
To compensate, holders of those longer bonds require a risk premium (called the term premium), and the premium is larger both the longer the maturity and the greater the perceived risk.[7] The premium adds to the average expected yield over the maturity, and the yield curve tends to slope up. The chart above illustrates a hypothetical situation where the expected annual interest rates for the next 30 years are all 1%, but the risk premium that holders of longer-term bonds demand produces an upward sloping yield curve.
Unfortunately, we can’t observe either expected future 1-year interest rates or the risk premium in isolation. We can say only that the upward sloping yield curve reflects a combination of expectations for changes in 1-year interest rates and the bond risk premium.
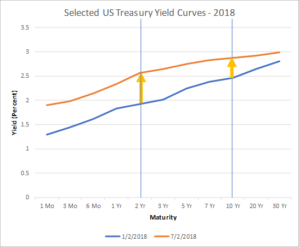
Now let’s look at changes in the yield curve. The chart above compares full yield curves from January (blue) and July (orange) of this year. We can see:
- Every yield has risen
- Yields at shorter maturities (including 2 years) have risen more than yields at longer maturities (including 10 years)
So, interest rates (yields) have risen, and the yield curve has flattened. The orange curve does look mostly flatter than the blue one, doesn’t it? [However, just to accentuate the complexity again, notice that the orange curve is steeper from 1 to 2 years than the blue curve.]
Suppose that the yields at shorter maturities continued to grow faster than the yields at longer maturities. Eventually, the short maturity yields would be higher than the long maturity yields, and specifically, the yield for the 2-year maturity would be higher than the yield for the 10-year maturity. The yield curve would slope down. Since it usually slopes up, a downward sloping yield curve is said to be inverted.
Why does it matter whether the yield curve is inverted?
Our historic experience is that an inverted yield curve is associated with a following recession.[8] (A recession is a decline in economic activity for 2 calendar quarters in a row.) The chart above illustrates this relationship (“term spread” is the difference between 10 year yields and one year yields – another way of saying yield curve). The red circles indicate times when the yield curve became inverted, and the gray-shaded time periods are recessions.
Every red circle is followed by a gray-shaded time period. The history (as illustrated by the chart) appears to be definitive. And yet,
- The length of time from the inversion to the recession can be long (1965) or short (2003).
- There appears to be no link between the size of the inversion and the length or depth of the recession (2007 to 2009 was the Great Recession, the worst since the Great Depression, but the inversion is much smaller than the inversions of the late 1970s and early 1980s).
Why would yield curve inversions predict recessions? Recall why the yield curve might slope down:
- Interest rates are expected to be lower in the future.
- Lower interest rates are associated with reduced economic activity – the inverted yield curve might indicate that investors are forecasting a recession.
- Since banks borrow at short maturities and lend at long maturities, bank lending is likely to be less profitable when the yield curve is inverted; that might slow the economy.
- The term risk premium is smaller for longer maturity bonds. This might happen if investors believe that the risk of future interest rate increases is small – again, an indication of reduced economic activity in the future.
However, there is no consensus view about why the link between yield curve inversion and recessions exists. Economists would say that it is an unexplained empirical regularity.
Should you be worried about an inverted yield curve?
This question combines three questions:
- Will the yield curve invert?
Answering this question requires us to forecast both short-term and long-term interest rates, which is very difficult to do. Beyond the usual complexity of forecasting interest rates, we must incorporate predicting the actions of central banks such as the US Federal Reserve (the Fed), who have been unusually active in the bond markets since the Great Recession.
Short-term interest rates have been rising recently. The Fed has been encouraging this rise by raising the Federal Funds rate (the interest rate at which banks lend to each other overnight).
Since 2009, the Fed has also been working to hold down long-term interest rates, first by purchasing and now by holding a very large quantity of longer maturity bonds (“Quantitative Easing”). Recently, the Fed has begun to reduce its holdings of these bonds: it no longer replaces them as they mature. This could raise yields at the longer end of the yield curve, but longer maturity interest rates appear to respond less directly to the Fed’s management attempts than short term yields do.
Finally, the Fed is fully aware of the link between yield curve inversions and recessions. Usually, it designs interest rate policy to counter inflation (which is approximately at the 2% target level) and to ensure that the economy doesn’t “overheat” (often signaled by rapid wage increases, which are not occurring). The risk of a yield curve inversion might induce the Fed to slow or even stop increases in the Federal Funds rate.
- If it does, will there be a recession and when?
Probability models of recession based on recent history suggest that if the yield curve inverts and stays inverted, there is roughly a 1 in 4 probability that a recession would start within one year, and a 3 in 4 chance that a recession would start within two. Probability models for several European countries are in broad agreement.[9] This suggests that the odds favor a recession ensuing within a year or two, but the timing is imprecise (a year is a long time!) and likelihood and certainty are two different things.
- If there is a recession, should I worry?
A recession is a slowdown in economic activity. Unemployment tends to rise, wage growth tends to slow, and stock market performance is more likely than usual to be poor.
Boom times are better for looking for a new job or asking for a large raise. Recessions tend to shake out companies that are weak competitors; employers are more likely to review their work forces to manage costs.
It is always worthwhile to assess your employment situation. Do you enjoy your work? Are you happy with your employer and vice versa? Is your network strong (could you rely on it to help you find a new role if your current one didn’t work out)? More confidence in your employer, your job and your career can be helpful in more stressful recession times.
The stock market can decline in a recession. Unfortunately, the timing and depth of any decline, and the timing and scale of the (hoped for) ensuing recovery are unpredictable – there is no evidence that investors can use a yield curve inversion to improve their investment returns by moving in and out of the market or changing their asset allocations. Regularly reviewing your portfolio to ensure that it is well diversified and that your risk exposure is consistent with both your risk capacity and your risk tolerance can help you weather any market turbulence with equanimity.
Rick Miller is the founder of Sensible Financial Planning and Management. Got a question for Rick about the stock market? Ask in the comments section below, or get in touch with us via email.
[1] What’s the Yield Curve? ‘A Powerful Signal of Recessions’ Has Wall Street’s Attention, New York Times, June 25, 2018
[2] Behind the Flattening Yield Curve: Fed Rate Increases and Tariff Fights, Wall Street Journal, July 5, 2018
[3] Flattening Yield Curve Raises Warning Flag, Wall Street Journal, April 18, 2018
[4] Treasury securities are issued at regular intervals (monthly, quarterly, annually), but they trade all day, every day. Market interest rates and yields can change at any time.
[5] I have altered Treasury Bill pricing and trading mechanics slightly for simplicity.
[6] Academicians may use slightly different definitions – while the long maturity seems usually to be 10 years, the shorter maturity may be 1 year, or even 3 months.
[7] When declining inflation or even deflation is a worry, the term premium can be negative. John Y. Campbell & Adi Sunderam & Luis M. Viceira, 2017. “Inflation Bets or Deflation Hedges? The Changing Risks of Nominal Bonds,” Critical Finance Review, vol 6(2), pages 263-301, cited in “Why Are Long-Term Interest Rates So Low?”, Bauer, Michael D. and Glenn D. Rudebusch, FRSBF Economic Letter, December 5, 2016.
[8] “Economic Forecasts with the Yield Curve,” Bauer, Michael D. and Thomas M. Mertens, FRBSF Economic Letter, March 5, 2018. Their definition of the term spread is the difference between the ten-year and one-year Treasury yields. Figure 1 is drawn from this article (I have added the circles.)
[9] Estrella, Arturo, and Frederic S. Mishkin. 1997. “The Predictive Power of the Term Structure of Interest Rates in Europe and the United States: Implications for the European Central Bank.” European Economic Review 41(7), pp. 1,375 – 1,401.


