
A recent Wall Street Journal article raises concerns about exchange-traded funds (ETFs). Specifically, on August 24th, a day of extraordinary stock market volatility, several ETFs traded well below the values of their underlying securities (their net asset values or NAVs).
You might wonder whether you should be concerned about this issue – after all, Sensible Financial® portfolios include a number of ETFs.
I believe that the short answer is no. ETFs are robust – they rely on the profit motive of market participants to keep each ETF market price close to its NAV. There may be (very) short periods when circumstances prevent the usual mechanism from working, but they are relatively easy to recognize.
To get a sense of how deviations of price from NAV might occur, and to assess in more depth whether this is a serious issue for ETFs as investment vehicles, it’s helpful to understand something about what ETFs are, and how they work.
Most ETFs are mutual funds (non-mutual fund ETFs differ from mutual funds in technical ways). Like traditional mutual funds, ETFs hold baskets of securities, and investors can buy some of every stock or bond in the basket with just one trade, diversifying very efficiently. ETFs trade throughout the day, whereas traditional mutual funds trade only after the market close.
Let’s take a concrete example. SPY (the SPDR S&P 500 ETF Trust) was the first ETF, and even today is one of the largest ones ($167B in assets). SPY tracks the S&P 500 index. The graph (taken from Google Finance) shows how closely SPY’s price (in blue) tracked the index (in red) on September 24, 2015 (the day I started this article). The index represents SPY’s NAV.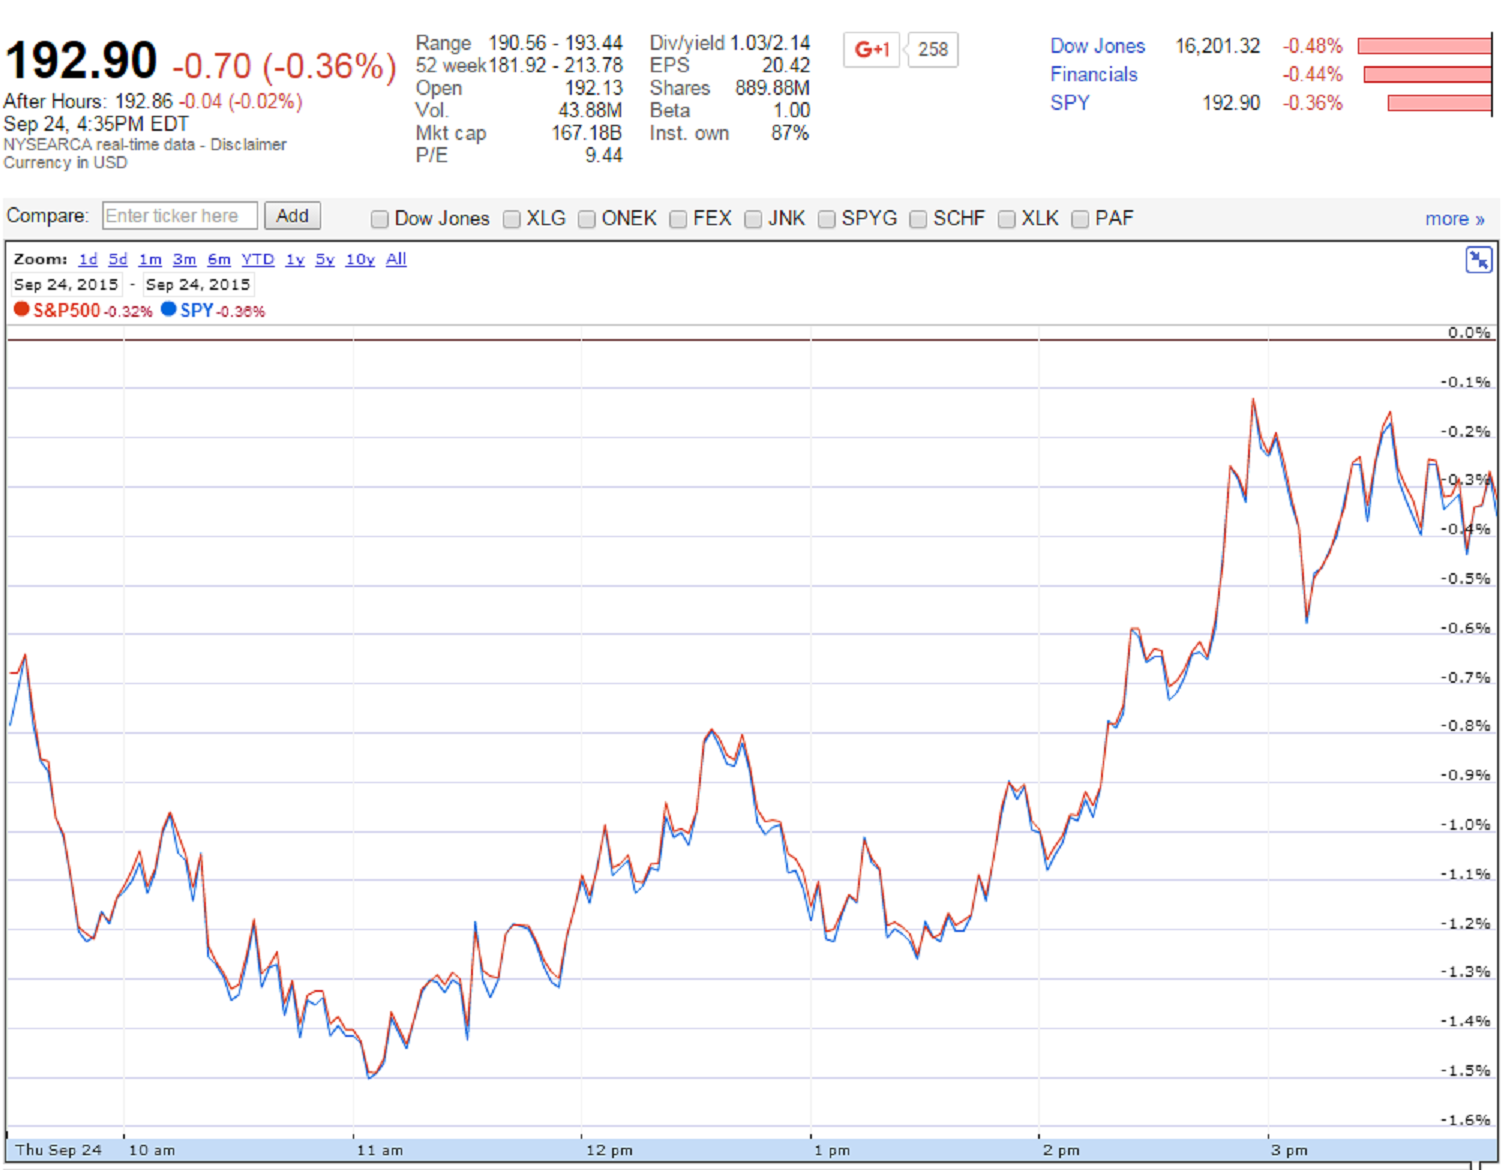
SPY’s NAV adds up the market values of all the stocks in the ETF. The table provides a small excerpt of the list of stocks that comprise SPY. I’ve included only the two largest companies in the S&P 500 (Exxon and Apple), and the two smallest (New York Times and Meredith). Exxon represents just over 3% of the value of the S&P 500, while Meredith Corporation represents barely .01% (third column of the table). On September 24th, SPY’s closing price was $192.90. The .0827 Exxon Mobil shares represented $6.01 of that value, and the .0005 Meredith shares, $0.02.
| Constitutent | Ticker | Proportion ofnSPY Value | Value in nCreation Unit | 9/24/15nClosing Price | Shares in nCreation Unit | Constituent Sharesnin one Spy Share | Component of nSPY NAV |
|---|---|---|---|---|---|---|---|
| Exxon Mobil | XOM | 3.12% | $300,653.94 | $72.73 | 4,134 | 0.0827 | $6.01 |
| Apple | AAPL | 2.41% | $232,425.21 | $114.92 | 2,022 | 0.0404 | $4.65 |
| --- | --- | ---- | ---- | --- | --- | --- | --- |
| New York Times | NYT | 0.01% | $1,176.69 | $11.62 | 101 | 0.0020 | $0.02 |
| Meredith Corporation | MDP | 0.01% | $1,099.53 | $46.46 | 24 | 0.0005 | $0.02 |
| SPDR S&P 500nETF Trust | SPY | 100.00% | $9,645,000.00 | $192.90 | 50,000 | 1.0000 | $192.90 |
The market decides how many shares of each ETF there will be. For example, suppose that investors are very excited about the prospects of large company US stocks. SPY holds the stocks of the 500 largest US companies, and investors can express that positive view by buying SPY. The price of SPY will rise, and it might exceed its NAV. That is, in the example above, the prices of the individual stocks making up the S&P 500 might not change at all, so that the NAV is still $192.90, but SPY’s price might rise. Suppose SPY’s price rose 1% (or $1.93) higher to $194.83.
This would create an opportunity for selected financial companies called “Authorized Participants” (APs) to earn substantial profits. APs can buy the components of the S&P 500 from the market and trade them to the fund advisor for ETF shares. They can then take the ETF shares to the market and trade them for cash, pocketing the difference between what they can sell SPY for (the market price) and what they paid for the components (the NAV). APs can keep doing this until the excited investors are sated, holding as many units of SPY as they want. In practice, this process bids up the prices of the components of SPY (and thus, the NAV) and simultaneously drives down the price of SPY. SPY’s NAV and market price converge.
If investors are concerned about large company US stocks, and don’t want to hold as much SPY, its price falls below its NAV and APs transact in the opposite direction. They buy SPY shares in the market, and trade them to the fund advisor for the shares of the component stocks. Then they sell the component stocks, and pocket the difference. The price of SPY rises, its NAV falls, and the two converge.
The minimum quantity of ETF shares APs can create (or destroy) in this way is a “creation unit.” In this example, we’ve assumed that SPY’s creation units are 50,000 shares. At an SPY price of $192.90, a creation unit would cost almost $10M (column 4 of the table). If the difference between SPY’s price and NAV was 1% or $1.92, an Authorized Participant could make $96,450 less its trading costs for every creation unit it traded. This example illustrates:
* APs require substantial financial capital (creation units are expensive!).
* Large differences between SPY’s price and its NAV mean large profits for APs
* Larger trading costs for the components of SPY or for SPY itself reduce the profits to APs
If APs have large profit opportunities when an ETF’s market price moves far from its NAV, what accounts for the large differences that emerged on August 24th? I believe that an important contributor to the problem was the “circuit breaker” mechanism: ‘trading in a stock pauses across U.S. equity markets for five minutes if the stock experiences a 10 percent price change over the preceding five minutes.’ 1
On the 24th, there were more than 1,200 trading pauses. During those pauses, by definition, an AP would have to wait to sell any affected underlying securities from the ETF. The AP doesn’t know how far those underlying security prices may fall. This makes the profit opportunity much riskier.
So, how can investors avoid the losses that may occur by selling an ETF when its price is well below NAV? There are several ways (all of which Sensible Financial employs):
1. Buy and hold investors (such as Sensible Financial clients) are very unlikely to experience problems of this sort in the first place. We trade relatively infrequently, and instances of large price / NAV deviations are rare.
2. If trading on days with trading halts, wait for the market to calm down. The large deviations of market price from NAV on August 24th lasted less than 6 minutes in the case of BlackRock’s iShares Select Dividend ETF, which trades under the ticker DVY.
3. When trading, employ limit orders. Setting a minimum acceptable sale price avoids sales at suddenly and unusually depressed prices.
Alternatively, one could simply avoid ETFs altogether, and hold only traditional mutual funds. It is not clear, however, that traditional mutual funds will always trade better than ETFs. Traditional mutual funds do always trade at NAV. However, they trade only after the market close. On many trading days, ETFs trade at more favorable prices during the day than the comparable traditional fund’s price at the close.
Unfortunately, there is no perfect investment vehicle. In my view, the benefits of both ETFs and traditional mutual funds far outweigh their flaws.
1 Paraphrased from the SEC Press Release at http://www.sec.gov/news/press/2010/2010-98.htm.