
To improve our recommendations, we are re-evaluating the economic assumptions in our financial plans. We will be rolling out newsletters and white papers on each assumption. In this article, I will discuss our new methodology for inflation and its effect on our recommendations.
What is Inflation?
Rarely a day goes by that we do not see changes in prices. Prices for food, housing, apparel, transportation, medical care, recreation, education, and communication are constantly changing. In this way, we are aware that prices increase over time.
The U.S. Bureau of Labor Statistics developed the well-known cost of living measure known as the Consumer Price Index (CPI). The CPI follows the prices that people pay for a basket of goods and services. The annual change in the CPI is generally seen as a good measure of changing prices. Figure 1 shows the annual change in the CPI for all urban consumers over the last one hundred years. Over that time, inflation has averaged 3.3%. This includes the peaks in 1947 (14.4%) and 1980 (13.5%) and the deflationary years of the 1920s and 1930s. Over the last twenty years, inflation has averaged 2.2%, including the deflationary year of the great recession in 2009 (-0.36%).
Figure 1. Annual Percent Change in Consumer Price Index for All Urban Consumers (1915-2015)

How Inflation Impacts You
Why are we so concerned with price changes? How do they affect you and your financial plan? First of all, let us start with a few definitions. In economics, the nominal value of an item is simply its current value. By contrast, an item’s real value is its current value adjusted for inflation. The real value of an item is its purchasing power in a given year. Inflation constantly reduces the real value (or purchasing power) of a dollar. One-hundred dollars today would buy you what ten dollars would have bought you in 1950.
What this means for you, therefore, is that inflation will reduce the purchasing power of your assets. For many people, their assets include pension income, annuity income, savings, and life insurance.[1] Higher prices will reduce the real value of these assets.[2] For example, if prices rise, a dollar of your pension or annuity income, savings, or life insurance death benefit today will buy you less than a dollar’s worth in the future.
The same is also true for your liabilities. For many people, their liabilities include home, auto, or student loans. Higher prices reduce the real value of these liabilities.[3] For example, if prices rise, a fixed-rate loan becomes less expensive over time. Paying down the principal today, therefore, will cost you more than what it would in the future.
Since 2002, Sensible Financial has assumed that inflation would run at 3%, just below the historical average. This assumption directly affects the recommendations we make in our financial plans. Therefore, if prices are lower, our plans will effectively recommend more savings and life insurance coverage than our clients need. As a result, the more accurate our forecast of inflation is, the more accurate our financial recommendations will be.
Forecasting Inflation
Economists at the U.S. Federal Reserve make quarterly inflation forecasts using statistical models. In the absence of unexpected shocks, these models project price increases over the next five years.[4] On the other hand, a market-based measure of inflation based on the CPI called the breakeven inflation rate generates projections of inflation over the next thirty years.
To understand the breakeven inflation rate, you must first of all know something about Treasury Inflation-Protected Securities (TIPS). TIPS are U.S. government bonds whose principal and interest payments increase with inflation.[5] The breakeven inflation rate is calculated as the difference between the yield on nominal U.S. Treasury Securities and the real yield (i.e., the yield in excess of inflation) on TIPS of the same maturity:
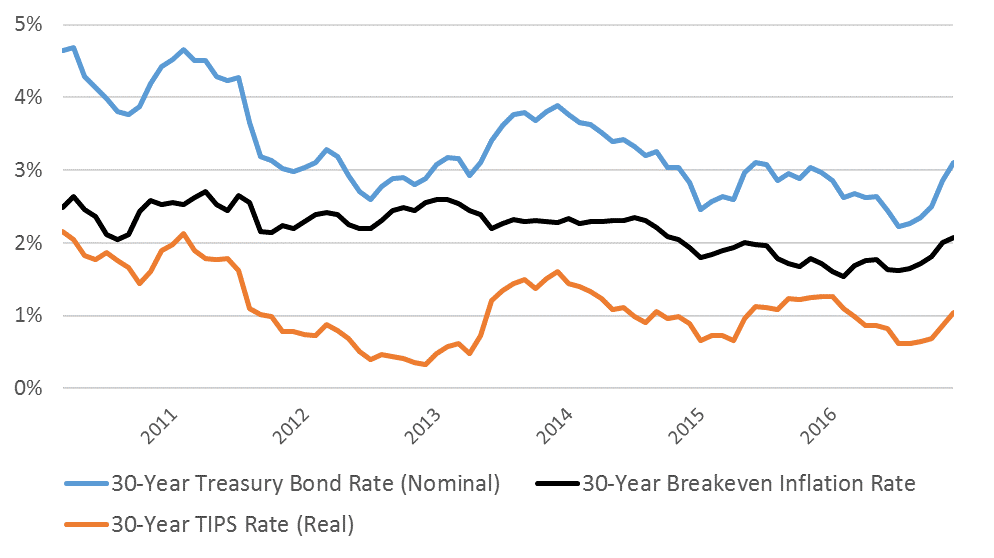
For example, Figure 2 figures the 30-year breakeven inflation rate (black line) as the difference between the nominal rate on 30-year U.S. Treasury Bonds (blue line) and the real rate on 30-year U.S. TIPS (orange line). If inflation over that period were equal to the breakeven rate, you would receive roughly the same return on an inflation-protected bond as you would on a nominal bond.[6] In short, the breakeven inflation rate gives us a simple market-based forecast of price changes.
Figure 2. The Breakeven Inflation Rate is the Difference between the Nominal U.S. Treasury Rate and the Real U.S. TIPS Rate
Updating our Inflation Assumption
To improve our recommendations, we will make a systematic change to the inflation assumption we use in financial planning. We will update our inflation assumption every year to the average 30-year breakeven inflation rate over the past ten years.[7] For example, beginning in 2017, we will adjust our current assumption of 3% annual inflation to 2.19%. In each following year we will revisit our assumption and update it.
We believe that replacing our current assumption with a market-based expectation of inflation will improve our recommendations. Because our new assumption is currently below our previous assumption of 3%, our new plans will in effect recommend slightly less savings and life insurance coverage than before. However, this change will be small if nominal assets and income in the plan (such as pensions and income annuities) are small.
[1] One’s wages, the largest financial asset held by most clients not yet retired, is typically considered to be in real dollars. In other words, one’s salary is expected to keep up with inflation.
[2] This would not so for pensions and income annuities that have a full cost-of-living adjustment (COLA) indexed to, for example, the CPI.
[3] This would not be so for loans with variable (rather than fixed) interest rates, such as floating-rate student or auto loans and adjustable rate mortgages (ARMs) that have their interest rates indexed to market rates.
[4] See http://www.federalreserve.gov/monetarypolicy/fomc_projectionsfaqs.htm.
[5] See https://www.treasurydirect.gov/indiv/products/prod_tips_glance.htm.
[6] If inflation were to average more than the breakeven rate, the inflation-protected bond would beat the nominal bond, and vice-versa.
[7] Using historical averages will smooth out major swings that may occur in the rates estimated by the market.