

In my fifth in a series of articles delving into investing in the first two decades of this century, I explore the growth of savings.
This article originally appeared in Forbes.com.
So far, we’ve looked at US stocks and bonds, international and emerging market stocks, factor investing, and hedged international bonds. We’ve seen that returns for every one of these categories have been varied, and that conventional wisdom doesn’t always work. We’ve also seen that changing your investment strategy based on the recent past is often precisely the wrong thing to do.
We may not think very carefully about the impact of investment returns on our investment results, however. After all, it seems obvious that if one asset had larger returns than another one for, say, two decades, savings invested in the first asset would grow faster than savings in the second.
The obvious turns out not to be true.
Higher average returns don’t guarantee more savings growth
The table lists twelve asset classes and asset class combinations (from now on, portfolios) I referred to in earlier articles. For each one, the first column provides the two-decade total rate of return and the second the average rate of return — the annual rate that if applied each year would produce the two-decade total return. For example, the US Aggregate Bond Index (fourth row) returned 74.3% after inflation from 2000-2019, which averages out to 2.8% per year (2.8% times 20 years is only 56% – the “magic of compound interest” provides the additional 18.3%). I have sorted the portfolios by real returns, from smallest to largest. The ranking is the same for both total and annual average returns.

Very importantly, I’m using these portfolios only as examples of return histories in this note. I’m not drawing investment implications or making recommendations.
Suppose we saved $40,000 on January 1st every year from 2000 to 2019. How much would we have accumulated in each portfolio if we’d earned the average rate? The third column provides the answer, in millions of dollars: from $.76M for Treasury Bills to $1.44M for the Russell 2000 (smaller company US stocks). Notice that the ranking of average returns and the savings we would have accumulated with average returns is the same.
Now suppose we saved in just the same way, but we received the returns as they happened each year (the “Observed” returns, shown in the fourth column). Now the rankings are different! Investing our hypothetical savings in the Russell 3000 Growth Index (an index of US Growth stocks — see this article) would have produced $2.13 million – much more than if we had received the average return, and also more than the Russell 2000 would have produced, even though the latter’s average return was much higher. How is that possible?
The order of returns is critical if we add to savings
It turns out the order in which returns arrive matters if we are adding to (or subtracting from) our savings. The example shown at right illustrates.
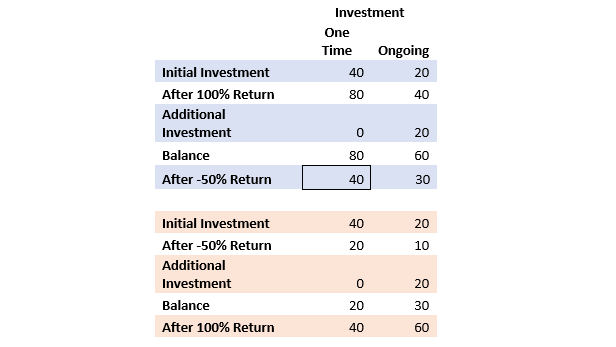
Suppose we invest for two years.
The top panel (blue shading) shows what happens with a 100% return (doubling our investment) in the first year, and a -50% return (halving our investment) in the second. If we invest our entire sum of $40k in the first year, we end up with $40k (the average return is 0%). With ongoing investing, $20k at the beginning of each year, we end up with $30k.
If we invest our entire $40K in the first year and reverse the order of returns (second panel, orange shading), with the -50% return in the first year, and the 100% return in the second, we get the same result. The average return is again 0%. It turns out this is a general result – changing the order of returns has no impact on the result if we do not add to or subtract from our investment. However, the order matters a lot if we do add to our investment. When we invest $20k each year, we end up with $60k — twice as much as in the first case. When the larger return (100%) arrives later, it applies to a larger investment, and thus produces a larger result.
This order of returns analysis applies to the last two decades of investment experience. The first column in the final table ranks our asset classes from lowest to highest difference between average annual investment return in the teens (2010-2019) and the aughts (2000-2009). This tells us which asset classes or groups had the biggest changes in returns from the aughts to the teens. US Aggregate Bond had 1.8% per year lower returns in the teens than in the aughts — returns declined. Russell 3000 Growth had 19.2% (13% vs -6.2%!) per year higher returns in the teens than in the aughts – returns grew.

The ranking is very similar in the second column, which reports the percentage difference between total amount we would have accumulated with the observed returns and the amount with average returns. The Russell 3000 Growth index is highest on both measures. Higher returns later would have produced better results than its average returns suggest, while US Aggregate Bond has lower later returns and worse than expected results relative to its average returns. Higher later returns tend to be related to observed returns savings results exceeding average returns results. Even the Emerging Markets index (MSCI Emerging), which appears to be out of order, is aligned with the order of returns explanation — within each decade of the aughts positive or high returns follow negative or low returns (these details not shown in the table).
Average returns are no indicator of future yields
In conclusion, average returns tell us little about the savings results we will experience over an extended time if we are regularly adding to our savings. Excellent average returns may produce poor results if early returns were large and later returns were small, and lower average returns may not accurately represent your experience if the early years offered paltry returns but later years were excellent.
Unfortunately, simply knowing that every year’s returns matter, not just the annual average, won’t help you choose investments that will help you grow your savings. Future returns are unpredictable. However, it can provide a message of caution. One bad year of returns late in your saving and investing career can nullify many years of good returns or several years of great ones. Your portfolio tends to get larger as you get closer to retirement, and larger portfolios suffer larger dollar losses for any given percentage decline.
Moreover, choosing an investment strategy based on average historic returns can be a mistake on two counts. The past offers no guarantees for the future, and average returns are an incomplete guide to how a savings and investment plan would have performed. The order of returns matters a lot, too.