It is no secret that the Social Security program is financially unsustainable. Based on current projections, too little cash is coming in to cover future benefit payments. The first page of your Social Security Statement (the document reporting your lifetime earnings history and estimating your future Social Security benefit) states that “by 2034, the payroll taxes collected will be enough to pay only about 79 percent of scheduled benefits.”[1] Yes, you read that correctly! The U.S. Treasury Secretary forecasts that in just seventeen years the Social Security program will be unable to meet its financial obligations.
What does this mean for you and your financial plan? In the following series of articles, I will describe how the Social Security program works, including how the program generates revenues, pays benefits, and invests its reserves. I will look at the program’s historical and projected long-run financial standing, discuss how this is likely to affect you, and describe how Sensible Financial accounts for these expectations in its recommendations to clients.
Social Security is largely a pay-as-you-go program
Social Security works primarily by pooling contributions from those who are currently working and paying out benefits to those who are currently eligible. You can think of it as a wealth transfer between generations.[2]
The vast majority of program receipts come from payroll taxes (historically about 85-95%), while interest on savings and taxes on benefits make up the remainder. To fund Social Security benefits, the Social Security Administration (SSA) levies a 6.2% payroll tax on wages paid for employees and employers, each, up to an annually adjusted wage base of $127,200 as of 2017.[3] Furthermore, up to 85% of Social Security benefits are taxable as ordinary income.[4]
Every tax dollar goes to a trust fund (called the Old-Age, Survivor, and Disability Insurance or OASDI trust fund) that immediately pays monthly benefits to those who are eligible. You can think of it as a savings accounts managed by the U.S. Treasury Secretary. When tax collections exceed immediate benefit payments, the excess funds are invested in special U.S. Treasury bonds and held in reserve for future periods. When taxes are insufficient to cover immediate benefit payments, bonds in the trust fund are redeemed to cover the shortfall.
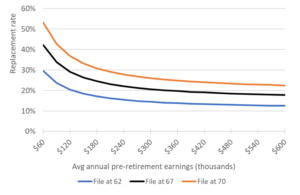
Social Security allocates nearly all program expenditures to paying benefits; less than 1% is spent on administrative expenses. Eligible beneficiaries include retirees and their families, surviving spouses and dependents, and those who are disabled and their families. To qualify for retirement benefits an individual must have at least 10 years of earnings on which they paid Social Security (payroll) taxes. The program bases retirement benefits on an individual’s inflation-adjusted earnings during their working career.[5] The higher your average annual pre-retirement earnings and the later you file for benefits (up to age 70), the higher your Social Security benefit. However, your Social Security benefit replaces a smaller percentage of your pre-retirement earnings the higher they are. The share of pre-retirement earnings that Social Security benefits replace for a retiree is called the replacement rate. Figure 1 shows the replacement rate for retirees who file at age 62 (the earliest you can file), 67 (“full retirement age”), or 70 (the latest you can file). For most workers, Social Security is likely to replace between 20% and 40% of pre-retirement earnings.
Figure 1. Social Security replaces a smaller share of (inflation-adjusted) pre-retirement earnings for those with higher earnings and for those who file before age 70.
Social Security will soon draw down its savings to pay benefits
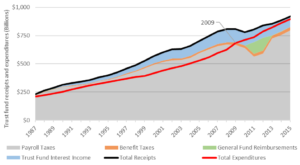
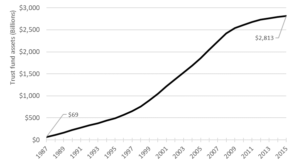
Over the last thirty years, Social Security has been cash flow positive.[6] Program receipts (black line) have exceeded program expenditures (red line) every year since 1987 (see Figure 2). Each year of surplus has grown the reserves of the Social Security trust fund. At the end of 2015, the trust fund held approximately $2.8 trillion in assets (See Figure 3). In short, Social Security is running a small annual surplus, trust fund reserves are larger than they’ve been in decades, and benefits are being paid as scheduled.
This is all good news. Unfortunately, given the magnitude of scheduled benefits (approaching $1 trillion a year) and the nation’s aging population,[7] the program will begin to rapidly draw down its reserves in the coming years to meet its financial obligations. The Board of Trustees of the OASDI trust fund (chaired by the U.S. Treasury Secretary) predicts that by 2022, program expenditures will exceed receipts. In fact, if you exclude interest income from Treasury bonds held in the trust fund (which will rapidly decline as bonds are redeemed to pay benefits), program expenditures have exceeded receipts since the end of 2009 (see Figure 2).
Figure 2. Program expenditures will soon exceed receipts
Figure 3. Trust fund assets have grown to nearly $3 trillion
It gets worse
The Board of Trustees estimates that the Social Security program will be unable to cover $12.5 trillion of its financial obligations (as measured in today’s dollars) over the next 75 years. This amounts to nearly 1% of the country’s projected gross domestic product (GDP) over that period. Something’s gotta give: benefit payments will decline or tax receipts will increase, or both. Congress, however, has made no progress towards passing the legislative reforms necessary to shore up the program’s finances. In fact, Social Security reform seems not to be on anyone’s agenda in Washington this year.
Conclusion
Based on current projections, the Social Security program will be in the red by 2022 and able to meet only about ¾ of its financial obligations by 2034. This means one of two things: all those eligible to receive benefits after 2033 will see a significant and permanent cut in benefits, or Congress will act to reform the program. The latter means some combination of benefit cuts and/or tax increases, of which the exact timing and magnitude are uncertain. However, the history of Congressional action and reasonable projections of the financial state of the Social Security program can provide a practical guide. In subsequent articles, I will examine the forecasts and discuss what they are likely to mean for you and your financial plan.
[1] You can sign up online to get your personal Social Security statement at https://www.ssa.gov/myaccount/. See an example statement at https://www.ssa.gov/myaccount/materials/pdfs/SSA-7005-SM-SI%20Wanda%20Worker%20Mid-career.pdf.
[2] In contrast, contributions to a defined benefit pension plan are legally owned by the contributor and are left to accumulate in the plan until the individual retires. Such “pre-funded” pension plans protect employees in case the company enters bankruptcy or goes out of business.
[3] Self-employed individuals pay the entire amount of the tax. The wage base is adjusted annually by the national average wage index. An additional 1.45% payroll tax is levied on all wages paid for employees and employers, each, to fund Medicare Part A.
[4] Those filing a joint tax return with a “combined income” greater than $44k per year must pay income tax on 85% of their benefits. Those with a combined income between $32k and $44k must pay income tax on 50% of their benefits. Those with a combined income less than $32k pay no tax. https://www.ssa.gov/planners/taxes.html. Between $32,000 and $44,000, you may have to pay income tax on up to 50 percent of your benefits more than $44,000, up to 85 percent of your benefits may be taxable.
[5] For family or survivor benefits, each family member may receive a percentage of your basic Social Security benefit, with a cap on the total amount of money paid to your entire family. For disability benefits, you and your family may be eligible to receive benefits based on your basic Social Security benefit if you meet the SSA’s definition of disability.
[6] All data regarding the program’s finances come from the 2016 and 2017 Annual Reports of the Board of Trustees of the OASI and DI Trust Funds. See full reports at https://www.ssa.gov/oact/tr/2016/tr2016.pdf and https://www.ssa.gov/oact/tr/2017/tr2017.pdf.
[7] For every 65-year-old in 1987, there were nearly 5 individuals aged 20 to 64. In 2015, there were 4, and the SSA predicts there will be only 3 by 2026. This falling dependency ratio implies that fewer and fewer tax payers will be supporting each eligible Social Security beneficiary or alternatively, each tax payer will be supporting more and more beneficiaries.
To speak with an advisor about planning for your financial future, contact us!


