
During the last quarter there was a lot of talk about “bond market dysfunction”. This may have raised questions for you. It is very likely that you hold bonds. You may wonder, what is this bond market dysfunction? How will it affect me? Should I be worried?
First, we will spend a little time exploring the bond market to understand something about how it works. Then we’ll talk about “bond market dysfunction” and how it might affect you.
US bond market overview
Just like the US stock market, the US bond market is very large (see Table 1) and very complex.
Table 1 ($T)
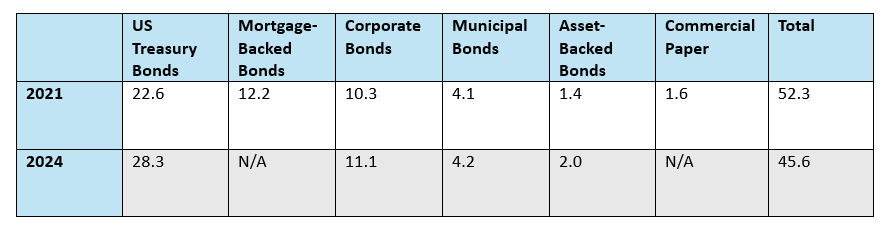
At a summary level, in 2021, the value of bonds in the US market was $52.3T (trillion with a T). In 2024, it was larger. SIFMA (the Securities Industry and Financial Markets Association) doesn’t break out data for Mortgage-Backed Bonds and Commercial Paper for that year, but the other categories were larger than in 2021. SIFMA also compares the US capital markets to those in the rest of the world. Both the US stock market, at $62.2T, and the US fixed income market, at $58.2T, are the largest in the world.
Again, just like the stock market, some simple principles apply to the bond market, even though it is complex in many ways. Thinking through these principles and their implications can help us better understand the bond market and provide some answers to our questions.
A good starting point is to refresh ourselves on what bonds are and why investors hold them.
Bonds are simply loans. Bond holders lend money to bond issuers. The issuers promise to repay the money lent to them and to compensate investors with interest payments.
There is a robust trading market in bonds. Investors in traded bonds rely on the reputations of the issuers (such as the US government, the governments of other countries, US states and municipalities, and large US and foreign corporations) to reliably repay the money they have borrowed and to pay the interest they owe.
The prices of tradeable bonds vary over time just as stock prices do. You might think loans should have a set price because the interest payments and the final principal payments are known well in advance. However, interest rates in the market vary continuously, depending on “market conditions,” and bond prices change in response.
“Market conditions” is a fancy name for supply and demand.
- If you think about bonds – tradeable loans – as the items supplied and demanded, then demand increases when investors want more bonds. More demand with no change in supply means higher bond prices.
- If you think about capital – money to be borrowed and lent – as the item supplied and demanded, then supply increases when investors offer to lend more money. More supply with no change in demand means lower prices for borrowing money. The price for borrowing money is the interest rate issuers pay investors. If investors offer to lend more money, lower interest rates result.
- Investors buying more bonds and investors lending more money are the same thing. Higher bond prices and lower interest rates are two sides of the same coin!
Changes in bond market conditions boil down to supply and demand changes for bonds and for capital.
- If investors decide they want to buy more bonds (they have more capital to lend), bond prices rise, and interest rates fall.
- If borrowers decide they want to issue more bonds (they need to borrow more capital), bond prices fall, and interest rates rise.
Why do investors and borrowers change the amounts of bonds they want to hold and issue or the amounts of money they want to lend and borrow? While there are far too many possible reasons to cover them all here, we can get some ideas just by thinking about our own finances. If we have extra resources, we may want to invest them to earn some return. We’ll be more willing to invest or lend them if we are confident about our circumstances – we might have a new and higher paying job, for example. On the other hand, if we have just bought a house that needs a lot of work, we may want to focus our resources there and choose to sell bonds to raise cash.
Similarly, our beliefs about the broader economy may influence our comfort with borrowing and lending. Evidence the economy is growing well is likely to increase our confidence that any loan we make will be repaid. If we think a recession is coming, we’ll have some doubts. We’ll want a higher interest rate to compensate us for the extra risk we perceive.
Now we are ready to think about bond market dysfunction. I asked Claude® and ChatGPT® (two artificial intelligence “chatbots”) to tell me about recent discussions of “bond market dysfunction.” As you might imagine, they identified multiple discussions. I’ve chosen to focus on the two most common here: reduced liquidity and increased volatility.
Definitions can help:
- Liquidity – The ability to buy or sell large amounts of bonds while having minimal impact on the price.
- Volatility – The sizes of fluctuations in market prices.
Let’s look at each of these in turn.
Liquidity
Picture this:
- It’s December 15th, 2023, 10:30 AM in the morning
- We are looking at the orders to buy and sell the then most recently issued 5-Year US Treasury Note (CUSIP 91282CJN2). The Treasury issued $55B of these bonds with a 4.375% coupon on November 30, 2023, to mature November 30, 2028. (Treasury Note is the official name for bonds with maturities between 1 and 10 years).
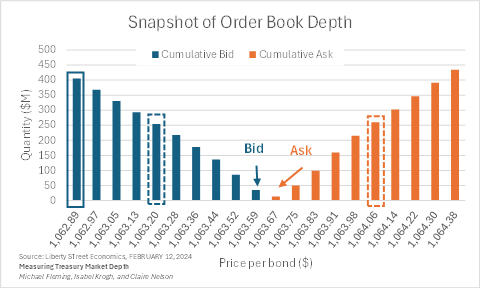
- Visualize the market for that bond: the market interest rate was about 3.91% (a bond price of $1,063.67). We can identify investors who want to buy that bond (blue bars on the chart) lined up in order of the price they are willing to pay, from highest (called the “bid”) to lowest. Each bar is cumulative – as we move left for buyers, the height of the bar represents the total value of bonds that buyers are willing to buy at that price. The blue dashed box highlights that buyers were willing to buy about $250 million of the bonds at $1,063.20 (some of these buyers would pay more – they are represented in one or more of the blue bars to the right). On the other side, those who want to sell (orange on the chart) line up in order of the price they are willing to accept, from lowest (called the “ask”) to highest. The orange dashed box shows that sellers were willing to provide about $300 million of the bonds at $1,064.14 or more.
- The difference between the highest price that a buyer is willing to pay (the bid) and the lowest price a seller is willing to accept (the ask) is called, wait for it…, the “bid-ask spread.” In this market, that spread is one “tick,” or one quarter of one thirty-second of one percent of the bond’s $1,000 par value. One tick is 7.8 cents.
- The chart illustrates “depth” – one measure of liquidity. Suppose a new seller arrives in the market and wants to sell $400M worth of bonds (about 400,000 bonds at $1,000 per bond). That seller would have to accept a price of $1,062.89 for their bonds (blue solid box), a price decline of 10 ticks or $.78 per bond, or .07%. If an individual seller had wanted to sell $100,000 worth of bonds, the price might have changed 1 tick, or .007% – practically no change at all.
This appears to be a very liquid market – very large purchases or sales have very small impact on bond prices.
However, the market’s very liquidity attracts many sophisticated traders. They try to make money by exploiting small inefficiencies in the market. They must make very large trades in those small inefficiencies to earn profits.
In some situations, those traders want to make their very large trades very quickly. Those trades can be so large that they overwhelm the market – there aren’t enough buyers or sellers to make all the trades. In our example above, a trader showing up with a $2 billion buy order could make the market appear to be less liquid (as the price would increase significantly).
The market order book doesn’t reflect all potential buyers and sellers, but only those actively seeking to transact right now. When the sophisticated traders want to buy a lot of Treasury bonds, they will eventually attract sellers who weren’t actively seeking to sell initially, but who can’t pass up the opportunity to sell at a price significantly higher than it was just a few minutes ago. In the longer run (which in this case could be a few hours), the market price of bonds will return to the level implied by the appropriate interest rate.
Importantly, this “dysfunction” says nothing about the fundamental value of the Treasury bonds in your portfolio. That value depends on investors’ assessment of the ability of the Federal government to make interest and principal payments on time.
Large swings in Treasury bond prices due to these trading issues may make for a poor time to sell some of your bonds or to buy more, but don’t imply that their value is threatened. When we trade for you, we avoid trading at times like these.
Volatility
Volatility is a measure of price changes. If stock prices drop a lot, or interest rates rise (and bond prices fall) a lot, the respective markets are said to be volatile. Large rises in stock prices or declines in interest rates (rises in bond prices) are also examples of volatility, but investors enjoy these changes and usually don’t complain about them.
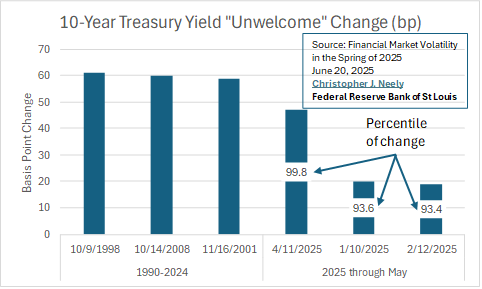
The chart compares bond market volatility in the first part of this year to the three largest volatility episodes between 1990 and 2024. The first of these occurred in 1998 during the bond market recovery from the Russian default a couple of months earlier. The second was during the Great Financial Crisis and the last during the implosion of the tech stock market bubble in 2001. In comparison, this year’s yield increases were substantially smaller. However, they did rank in the top 10% of one- to five-day yield increases between 1990 and 2024.
Yield / interest rate increases mean lower bond prices. Often, interest rate increases reflect market perception of increased risk – think of Puerto Rico recently, or Greece some years ago. On the other hand, higher real interest rates can be associated with strong investment activity and many attractive investment opportunities – economic growth.
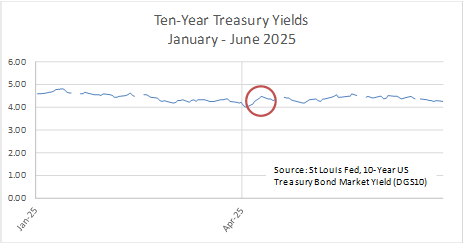
Volatility is not necessarily a sign of market dysfunction. More often, it reflects market reaction to important changes in economic information. In the case of the bond market, interest rate increases can reflect concerns about the likely performance of the economy. The largest increase this year followed closely on President Trump’s tariff announcement on April 2. In the event, rates in the three months after the large increase (circled in orange) stayed in the same range as earlier in the year.
As in the case of liquidity, there was no fundamental concern on the part of investors about the value of US bonds, but there was a belief that interest rates were likely to rise – Treasury bond prices were likely to fall. This didn’t happen (through June 30, at least).
In summary, the bond market “dysfunctions” reported in April did not provide news about the fundamental value of your Treasury bonds. Instead, they told us that even the largest and deepest financial market in the world is not perfect. Sometimes prices will jump (there is some illiquidity), and sometimes price changes will be large (volatility). Neither possibility tells us that the fundamental value of the bonds is threatened.
Photo by Pierre Bamin on Unsplash