

In my sixth in a series of articles delving into investing in the first two decades of this century, I explore how well a retirement savings portfolio would have held up.
This article originally appeared in Forbes.com.
So far, we’ve looked at US stocks and bonds, international and emerging market stocks, factor investing, hedged international bonds, and retirement income. We’ve seen that returns for every one of the investment categories have been varied, and that conventional wisdom doesn’t always work. We’ve also seen that changing your investment strategy based on the recent past is often precisely the wrong thing to do.
In our last article we looked at how savings accumulated. In this one, we’re going to look at withdrawals from a nest egg. Just as with savings, the impact of investment returns on our retirement portfolio as we withdraw from it can be surprising. Just as with savings, what seems at first blush to be obvious turns out not to be true. Just because one asset has larger average returns than another doesn’t mean investing retirement savings in that asset is the best move.
Higher average returns don’t guarantee better retirement outcomes
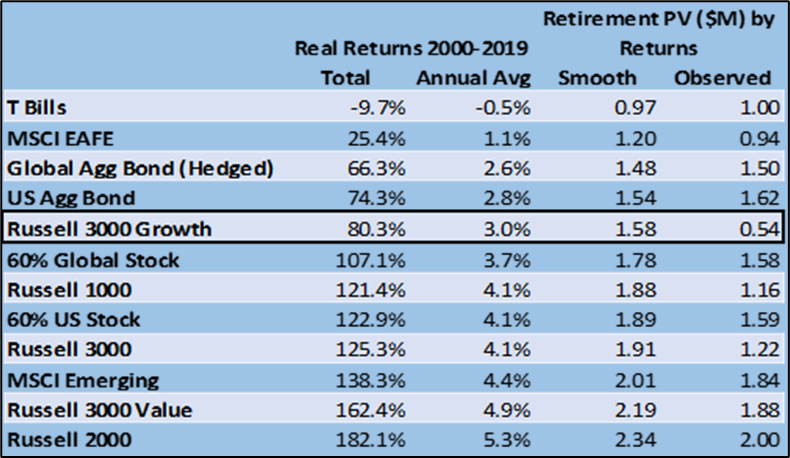
The table lists twelve asset classes and asset class combinations (from now on, portfolios) I referred to in earlier articles. For each one, the first column provides the two-decade total rate of return and the second the average rate of return — the annual rate that if applied each year would produce the two-decade total return. For example, the Russell 3000 Growth Index (fifth row) returned 80.3% after inflation from 2000-2019, which averages out to 3% per year (3% times 20 years is only 60% – the “magic of compound interest” provides the additional 20.3%). I have sorted the portfolios by real returns, from smallest to largest. The ranking is the same for both total and annual average returns.
Very importantly, I’m using these portfolios only as examples of return histories in this note. I’m not drawing investment implications or making recommendations.
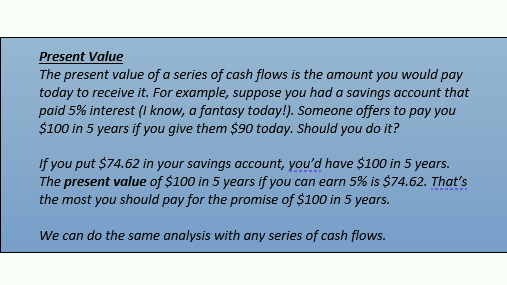
Suppose we started with $1,000,000 and withdrew $40,000 on January 1st every year from 2000 to 2019 (applying the so-called “4% Rule”). What would be the present value of the distributions and the ending balance for each portfolio if we’d earned its average rate? We use Treasury Bills as our “savings account interest rate” (see Present Value box below).
The third column provides the answer, in millions of dollars: from $.97M for Treasury Bills to $1.34M for the Russell 2000 (smaller company US stocks). Portfolios rank in the same order by average returns and by the present value of cash flows plus ending balance with average returns.
On the other hand, suppose we received the returns as they happened each year (the “Observed” returns, shown in the fourth column). The rankings are very different! In particular, drawing from our hypothetical nest egg invested in the Russell 3000 Growth Index (an index of US Growth stocks — see this article) would have caused us to run out of money in 2014 (analysis not shown) – and we’d have put in $1M to buy a stream of cash flows worth only $540,000. What a waste!
That’s the worst present value of any portfolio, even our “savings account” Treasury Bills. How is that possible?
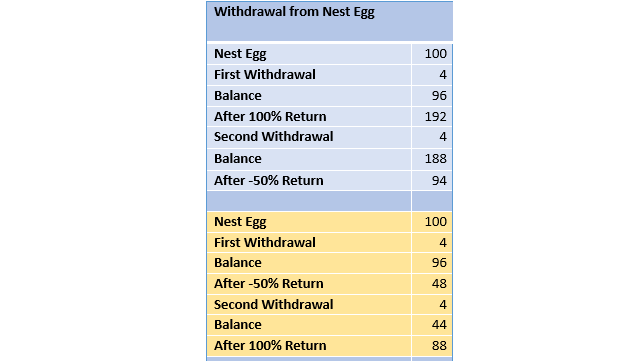
The order of returns is as critical when we withdraw from our savings as when we add to it
Just as we saw with savings, the order in which returns arrive matters if we are withdrawing from our nest egg. The table above illustrates.
Suppose we have two years of withdrawals of $4 from our $100 nest egg.
The top panel (blue shading) shows what happens with a 100% return (doubling our investment) in the first year and a -50% return (halving our investment) in the second. Our nest egg withdrawal strategy nets us $94.
If we reverse the order of returns (second panel, orange shading), with the -50% return in the first year and the 100% return in the second, we end up with $88. Just as with saving, the order of returns matters when we withdraw from our nest egg. When the gain (100%) arrives earlier, it applies to more assets, and thus produces a better result. This is the reverse of what we saw with savings, when larger returns arriving later produced larger results.
Whether we’re adding to or taking away from our portfolios, we gain more when large balances garner large returns and lose less when poor returns apply to small balances. When we are withdrawing, larger balances tend to be earlier in the cash flow series. Larger balances tend to be later in the series when we are saving.
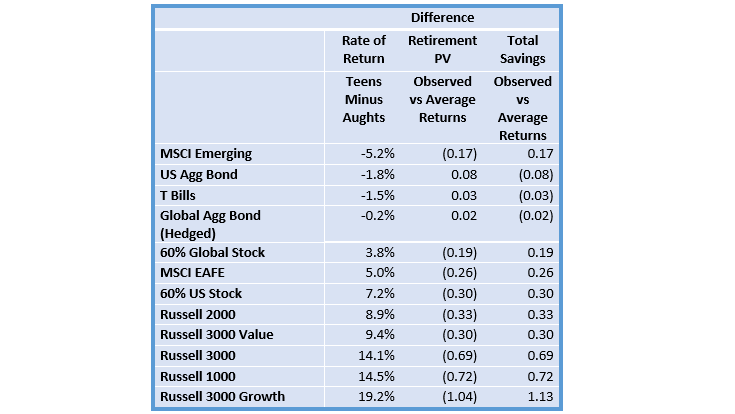
Let’s see the impact of different orders of returns on nest egg withdrawals over the last two decades. The first column in the final table ranks our asset classes from lowest to highest difference between average annual investment return in the teens (2010-2019) and the aughts (2000-2009). This tells us which asset classes or groups had the biggest changes in returns from the aughts to the teens. US Aggregate Bond had 1.8% per year lower returns in the teens than in the aughts — returns declined. Russell 3000 Growth had 19.2% (13% vs -6.2%) per year higher returns each year in the teens than in the aughts – returns grew.
The ranking is very similar in the second column. That column reports the present value difference in our series of distributions and final balances between observed returns and average returns. The Russell 3000 Growth index is highest on both measures. Higher returns later would have produced much worse ($1.04M worse) results than its average returns suggest, while US Aggregate Bond has lower later returns and better observed results relative to its average returns. Higher later returns tend to be related to observed returns distribution results being lower than average returns results. Even the Emerging Markets index (MSCI Emerging), which appears to be out of order, is aligned with the order of returns explanation — within each decade positive or high returns follow negative or low returns (these details not shown in the table).
I drew the third column from the previous article about savings. It is almost exactly the negative of the second column. That is, the sequences of returns that are relatively worst for withdrawals relative to their average are relatively best for savings, and vice versa! (The difference for Russell 3000 Growth is due to the nest egg being exhausted by the withdrawal series before 2019.)
Just as with savings, average returns tell us little about the nest egg distribution results we will experience over an extended time if we are regularly withdrawing. Excellent average returns may produce poor results if early returns were small and later returns were large. Lower average returns may not accurately represent your experience if the early years offered large positive returns even if later years were poor.
Just as we saw with savings, knowing not only the annual average but also every year’s returns is important. But it still won’t help you choose investments to help you preserve your nest egg because future returns are unpredictable. However, we can say that one bad year of returns early in your retirement can mean that you exhaust your nest egg prematurely. Your portfolio is largest just as you retire, and larger portfolios suffer larger dollar losses for any given percentage decline.
Moreover, choosing an investment strategy based on average historic returns can be a mistake on two counts. The past offers no guarantees for the future, and average returns are an incomplete guide to how a distribution plan would have performed – the order of returns matters a lot, too.