
 In my previous article, I introduced my friend Tim who wanted to know how to calculate his fund’s performance. I described the simplest method of calculating returns, holding period return, which is just the percentage change in value of an investment over time. Holding period return has limited value, however, since it assumes that all cash flows occur at the beginning and end of the period.
The two primary methods of calculating investment returns are time-weighted return – also known as “total return” – and money-weighted return – also known as “dollar-weighted return” or simply “IRR.” Both methods take into account intra-period cash flows, solving the holding period return problem.
The reason why firms like Sensible Financial® provide both time-weighted and money-weighted return figures is because each provides an accurate measure of performance. Understanding how to interpret the results is fundamental to understanding investment returns.
In this article, I’ll describe what each method measures and when to use one or the other. In my final article, I’ll show in detail how each method is calculated.
A Tale of Two Returns
To understand the difference between the two, let’s begin with a simple definition of each:
Time-weighted return measures the amount that $1 compounds over a particular time period. This is the preferred industry standard because it lets investors compare different investments.
Money-weighted return measures an investor’s actual return over a given time period taking into account all cash inflows (deposits) and outflows (withdrawals). When most investors think “return,” they are probably thinking in terms of money-weighted return.
Here’s the important point:
Time-weighted return measures the hypothetical growth of $1 invested over some time period. Money-weighted return measures an individual’s return, taking into account actual cash flows.
Let’s return to my friend Tim to clarify these concepts. Assume Tim owned shares of DFEOX and wanted to know how his fund compared to the broad US stock market in 2015. If Tim goes to DFEOX’s Morningstar performance page, he will find the following table:
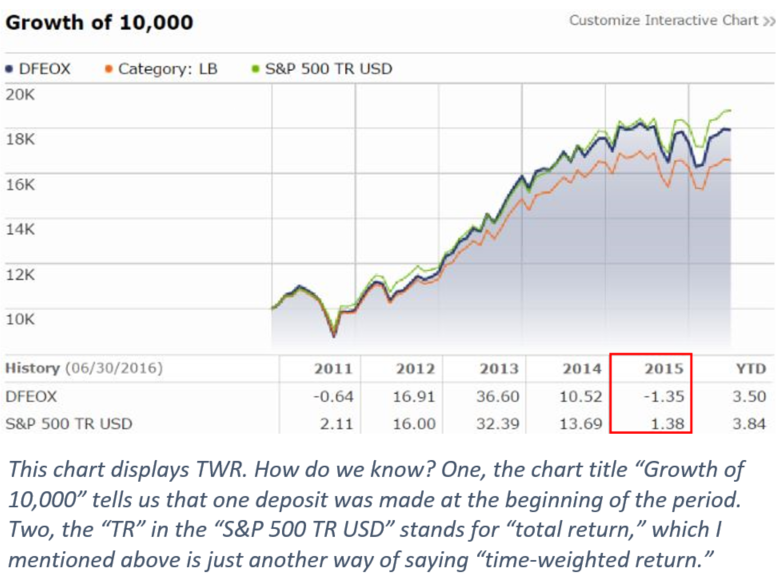
This table tells us that in 2015, if Tim invested $1 (or $10,000 or $100,000) into DFEOX and another dollar in the S&P 500 index, at year end he would have made -1.35% and 1.38% respectively. These returns are time-weighted returns. For the year ending 2015, DFEOX underperformed the S&P 500 benchmark by ~2%.
Time-weighted return is the appropriate measure of performance to use when you want to compare two or more investments.
Still, there’s another way we might measure Tim’s fund’s performance. Instead of assuming that he put all of his money into DFEOX at the beginning of the year and walked away, what if in fact Tim purchased $1,000 of DFEOX every month in his 401k? His money-weighted return would be different. The below chart, which shows the price changes of DFEOX over 2015, tells you why.
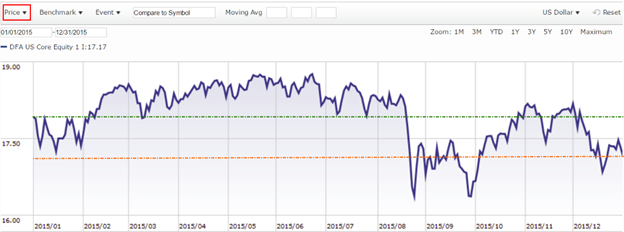 Remember that TWR assumes that Tim bought a share at the beginning of the year and sold it at the end. But in reality, Tim bought shares every month for a year. We need to take into account his actual cash flows to calculate his MWR.
If Tim buys $1,000 of DFEOX at the end of every month in 2015, his account will be worth $11,785 at year end. His money-weighted return is -3.48%. (I’ll cover the actual math in my next article). That’s about 2% worse than his time-weighted return. How is that possible? If you compare the portion of the chart above and below the green line, you’ll see that most of the chart lies above it, meaning that Tim purchased more shares above the price used to calculate TWR, resulting in a lower MWR.
Money-weighted return is the appropriate measure of performance to use when you want to measure your individual return, taking into account all deposits and withdrawals.
In Conclusion
So Tim earned -3.48% in 2015, even though his chosen fund earned -1.35%. Tim’s timing was unfortunate, so he didn’t do as well as he would have done had he invested all of his savings at the beginning of the year.
Importantly, it would be incorrect for Tim to compare his -3.48% money-weighted return to the fund’s -1.35% time-weighted return (or even the S&P 500’s +1.38%). This is a common mistake many investors make that can lead to a lot of confusion. Money-weighted return and time-weighted return are simply not comparable. And while Tim could compare his -3.48% to a strategy of depositing $1,000 per month into the S&P 500, MWR comparisons of this type are nearly impossible for individuals to do themselves because of the complex calculations involved.
Congratulations! You can now count yourself among the minority of investors who understand the difference between time-weighted and money-weighted returns. If you have any questions, I encourage you to leave comments at the end of this article (if you’re unsure about something, chances are someone else is too).
Next month I will walk through a detailed example of how to calculate both types of returns.