
 The US Presidential election is fast approaching. It is worth asking whether investment returns vary in predictable ways or are especially risky at such times. Perhaps we should be taking some action? One might imagine presidential elections to have both short-term and long-term effects on the stock market. The short-term effects would reflect the impact of the election itself. Long-term effects would represent the impact of presidential leadership throughout each president’s term. In the short term, there are two possibilities:
- Prediction: As the election season proceeds, one candidate emerges as the likely winner. The stock market incorporates the likely result and forecasts future company performance and investment returns in that regime. In this case, there is no or only a minimal “election effect.”
- Surprise: Election results surprise investors, as the likely winner loses. Investors respond either favorably or unfavorably, and the stock market reacts accordingly, moving up or down sharply immediately after the election.
In the long term, there could be ongoing stock market effects of presidential leadership. Whether or not there is a discernable “election” effect, the market steadily (more or less) responds to the effective or ineffective leadership of the president.
As we begin this discussion, it’s important to acknowledge a number of significant difficulties:
- The US stock market is enormously complex, and the US economy and the world economy, within which the US stock market functions, are more complex by orders of magnitude. Many factors influence the stock market. Serious analysts have been unable to identify factors which predict stock market performance in a systematic way.
- Statistical analysis of this subject has important limitations.
- The number of presidential elections and presidents is small in a statistical sense. The canonical paper[1]) on this subject analyzed 13 presidents and 18 presidential terms.
- The analysis assumes that “Republican” and “Democrat” are unvarying and meaningful categories. So Roosevelt, Truman, Kennedy, Johnson, Carter, and Clinton are treated as the same for the purposes of this analysis, but significantly different than Eisenhower, Nixon, Ford, Reagan, and the first Bush, who are also all the same as each other.
- An analysis attempting to assign credit for stock market performance during a president’s term to the president alone lacks a comparator. Statistically, to attribute an historical result to the impact of factor A, we need a similar period of history where A was absent. Thus, to say confidently that the excellent stock market returns from 2009 to the present are due to President Obama’s leadership, we would need to compare the stock market results of his term with the returns from 2009-2016 under Presidents McCain and Romney, which is clearly not possible.
- The number of stock market cycles and stock market events is also small. If we say that modern stock market history begins in 1926 (along with Roger Ibbotson[2]), there are a very few long trend patterns such as the “Roaring Twenties,” the Great Depression, on through the Nineties, the Internet Bubble, the Great Recession, and the current recovery.
- So, we are trying to explain a small number of events (stock market cycles) with one factor, the political party of the US president.
- The number of presidential elections and presidents is small in a statistical sense. The canonical paper[1]) on this subject analyzed 13 presidents and 18 presidential terms.
- The channels of influence of US presidents on the economy and on the US stock market are tenuous at best.
- Presidents do not directly make decisions that influence corporate profits (which stock market performance depends on) such as
- Owning companies.
- Making private investment decisions.
- Making consumer purchase decisions (other than their own).
- Presidents do
- Nominate Federal Reserve Board (Fed) members, including the Chair.
- Make executive decisions and promulgate executive orders, including declaring disaster areas.
- Negotiate trade deals.
- However, the president does not dictate Fed policy (the Fed is famously independent), and the ability of the Fed to manage the economy, let alone the stock market, is controversial. The declaration of disaster areas has minimal impact on stock market performance, as do most executive orders. Trade deals last far beyond the terms of the presidents that make them (for example, NAFTA was signed in 1992 by President George Bush, and has been in force through the presidencies of Clinton, G W Bush, and Obama). So, even if we find a statistical association, we may be hard pressed to articulate reasons to believe that it is meaningful, and have an enormously difficult time believing that there is causation.
- Presidents do not directly make decisions that influence corporate profits (which stock market performance depends on) such as
What do the data say?
As far as short term effects are concerned, the authors are unable to identify many surprises. Only 4 of the elections in their sample were wrongly forecast by Gallup (the leading pollster of the period covered by the analysis), or with very close outcomes.
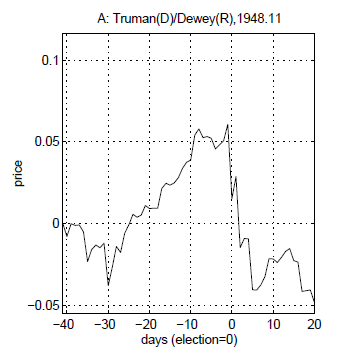
Of those 4, only Truman defeating Dewey[3] produced a large stock market move. The market declined roughly 10% between the day before the election and 20 days afterward. The chart[4] below also shows that the decline was about 5% from 40 days before the election to 20 days afterward.
However, it’s hard to argue that the effect was either persistent or important. The red circle on the S&P 500 historical chart[5] below contains the period surrounding the Dewey / Truman election. The stock market was in a holding pattern for the first year of Truman’s term after the election, and then moved upward. Of course, some might suggest that it would have moved higher under Dewey, but as I indicated above, that’s an assertion that is impossible to test. In the scheme of things, not much to see here.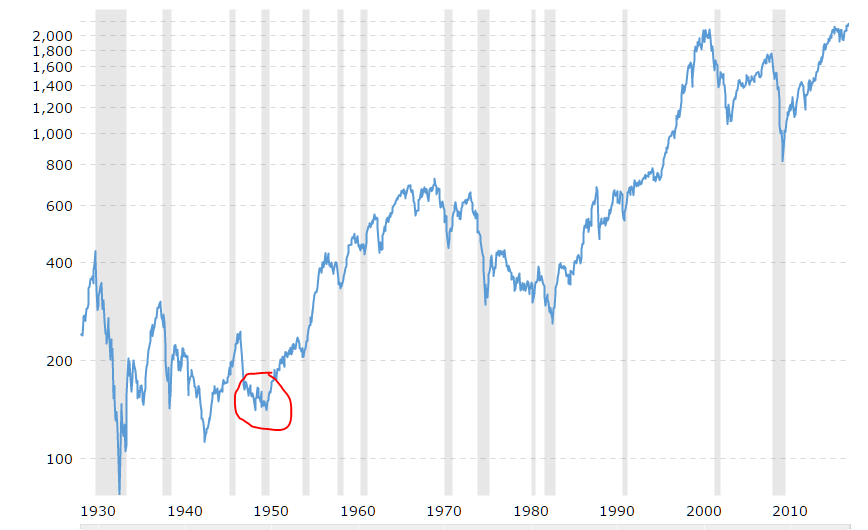
As far as the long run is concerned, Santa-Clara and Valkanov find that the stock market has performed substantially better under Democratic presidents than under Republicans (as in, 10% per year!). They look at three time periods (1927-1998, 1946-1998 and 1960-1998), and the finding holds in each one. The difference is statistically significant.
However, I must confess that I’m not persuaded.
The problem is not that the presidents had no influence on the stock market outcomes – I’m sure that to some extent they did. The problem is that major market movements (such as the market crashes in the Great Depression and Great Recession) have a disproportionate influence on the analysis, and I don’t believe that we can assign responsibility for those major movements to the president.
For example, starting in 1927 means blaming the Great Depression stock market crash (that’s an 82% decline in real terms) entirely on Herbert Hoover, a Republican, while Franklin Roosevelt, a Democrat, gets the recovery. Bill Clinton, a Democrat, gets credit for the Internet boom of the 1990s. While there is something to be said for the argument that Al Gore invented the Internet,[6] Clinton was president in the 1990s, not Gore.
If the analysis were extended to the present day from 1998, George W Bush (a Republican) would be responsible for the Great Recession, while Obama (a Democrat) would get the recovery. However, many of the seeds for the Great Recession were planted under Clinton and even before, and Bush (not Obama) appointed Ben Bernanke, the Fed Chair credited by many with masterminding the recovery.
In short, my sense is that the Santa-Clara and Valkanov results are more a matter of luck than causation – presidents have been present during stock market movements, but not responsible for them. Incidentally, when they expand the analysis to include the party in control of the House and the Senate, Santa-Clara and Valkanov are no longer able to attribute differences in stock market performance to the party of the president in power.
Anticipating stock market results either for the following four weeks or for the next four years based on who wins the election is thus not supported by the evidence, in my view.
So, what to do?
As I write (at 4 PM on Tuesday, October 18th), FiveThirtyEight (http://projects.fivethirtyeight.com/2016-election-forecast/national-polls/), which collects polling information from many reputable polling entities, shows Clinton with a 45.6% to 38.9% lead, and almost an 85% chance of winning the election.
You could think of FiveThirtyEight as producing a “meta-poll.” It summarizes the findings of many independent polling organizations, each with its own methodology and sample of respondents.
In a sense, the stock market is similar, collating information from a myriad of sources, and producing a single number incorporating the views of every market participant in proportion to share ownership. The stock market likely has “priced in” a high probability that Clinton will win – market participants effectively are probably summarizing the available polling information just as FiveThirtyEight has done. (The Irish bookmaker Paddy Power is already paying out on a Clinton victory.[7])
Thus, a Trump victory would qualify as a surprise.
To make an investment decision, we need to have strong beliefs about:
- What could happen.
- When it might happen.
- How the markets are likely to react
- In the short run.
- In the long run.
I’ll posit the beliefs one would need to make an investment decision about a Trump victory:
- Trump could win the election on November 8th (or the election is close enough to require a recount or there is uncertainty about Clinton’s ability to win in the Electoral College).
- Market reaction
- In the short run, until the uncertainty resolves, the stock market declines sharply, say 10% or more (if one doesn’t believe this, while one might be surprised about a Trump victory, there’d be no reason to change investments).
- In the long run, in reaction to a Trump victory, either
- The US stock market and global stock markets decline further, or
- The US stock market and global stock markets recover
If one believed that the stock markets would recover in the longer run, then market timing would be required – sell now, before Trump wins, and buy back after the decline but before the recovery. One would have to be able to identify the turning point. Very difficult to do.
If one believed that the stock markets would continue to decline indefinitely after a Trump victory, there is still a timing problem – when to sell and when to buy back. One could sell now, and buy back if Clinton wins, accepting the loss of market exposure between now and the day after the election as a modest price to pay for safety. One could wait and see, and if Trump wins, sell immediately, accepting the significant loss one expects to occur in that event.
Then, one could continue to hold cash until either
- One knew that the bottom had arrived; or
- Until Trump’s successor is elected or takes power.
Choice a) again is a timing problem, choice b) works only if markets continue down throughout Trump’s entire term. The market is constantly forecasting the impact of news events on stock prices and on stock returns more broadly. To make money by trading in and out of the market, one must forecast those impacts before the market does and more accurately than the market does – a tall order.
Summing up:
- The evidence for presidential effects on stock market performance is weak at best.
- Even if one were confident that there would be a “Trump effect,” one would still have a significant market timing problem to solve.
Sensible Financial® is inclined to treat the possibility of a Trump victory no differently than we would almost any other news event. We believe that the stock market forecasts investment impacts of news events more accurately than individual people do, and that the durations and sizes of market responses to those forecasts are not predictable. We encourage our clients to manage the uncertainty of investment returns by diversifying their investments to limit exposure to individual securities and maintaining stock exposure at risk-affordable levels.
Nevertheless, we recognize that you may find the prospect of either a Trump or a Clinton victory to be very unsettling, and you may wish to adjust your investments accordingly. If so, please contact your advisor.
[1]Santa-Clara, P. and R. Valkanov, “The Presidential Puzzle: Political Cycles and the Stock Market.” The Journal of Finance, 2003. 58(5): p. 1841-1872.
[2]Ibbotson, R., et al., Stocks, Bonds, Bills, and Inflation 1992 Yearbook: Market Results for 1926-1991. 1992.
[3]https://en.wikipedia.org/wiki/Dewey_Defeats_Truman
[4]From Santa-Clara, P. and R. Valkanov, The Presidential Puzzle: Political Cycles and the Stock Market. The Journal of Finance, 2003. 58(5): p. 1841-1872.
[5]http://www.macrotrends.net/2324/sp-500-historical-chart-data
[6]https://en.wikipedia.org/wiki/Al_Gore_and_information_technology
[7]CBC News, October 19, 2016, http://www.cbc.ca/news/business/paddy-power-presidential-betting-1.3810006