- There is now a tendency for higher interest rates.
- Total bond returns equal the coupon (interest payment) plus the price change impact of any interest rate change. Neither the interest rate alone nor the interest rate change alone determine the total return. Both have an impact.
- In the long run, higher rates are good for savers and lenders.
The country is preparing for the transition from President Obama to President Trump, and from divided government (Republican Congress, Democratic President) to Republican government. Investors are preparing for changes, too. Bond investors are expecting interest rates to rise, and are wondering how best to manage their portfolios in response.
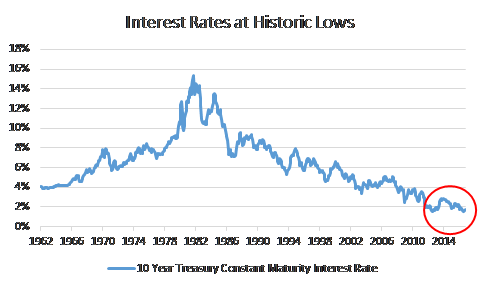
As we’ve discussed before, interest rates have been declining for decades, and are (or at least recently were) at historic lows. The chart illustrates the last 50 plus years of bond interest rates. I’ve circled in red the last four years or so. The 10 year interest rate has hovered around 2%. Scanning your eye across the graph will show you just how low that is in historic terms.
Much of the recent decline has followed the financial crisis of 2007-2009. Many of the forces that drove that decline are now weakening:
- The Federal Reserve is now encouraging interest rates to rise, or at least not to decline further.
- The US economy is much more vibrant and active now than it has been at any time since 2006.
- The rest of the world is also recovering from the crisis.
It follows that finally (credit market observers have been expecting this since 2011) interest rates are likely to rise. In fact, the 10 year constant maturity Treasury rate has been rising since July.
For savers and lenders, this is unvarnished good news. Higher interest rates mean better returns on savings accounts, on CDs, and ultimately, on bonds. Those of us anticipating or living in retirement will need a smaller savings account, CD holding or bond holding to generate the income we need. For example, for $10,000 income per year, we would need to invest $500,000 at 2%, but only $250,000 at 4% and only $200,000 at 5%.
Getting there may appear to be perilous, however. Rising interest rates mean falling bond prices – let’s take a moment to think about why:
- Start with a standard 10 year bond, par or face value $1,000, interest rate 1%, coupon (annual interest payment) $10.
- Imagine that interest rates rise to 10%.
- Now you can buy a standard bond 10 year bond with par value $1,000 and interest rate 10%, coupon $100.
- What is our 1% bond worth? Less (a good deal less), than our 10% bond, because
- Our 10% bond offers 10 annual payments of $100 plus our $1,000 back.
- Our 1% bond offers 10 annual payments of only $10 plus our $1,000 back.
- So, the price of our 1% bond declines.
- The difference in bond price would be smaller for bonds of shorter maturities. For one year bonds at 1% and 10%, there is only one annual payment of $100 or $10 before we get our $1,000 back. That also means that as time passes, and our 10 year bonds get closer and closer to maturity, the price difference will shrink. If interest rates stay at 10%, our 10% bond will continue to be worth $1,000. The price of the 1% bond will increase as the number of years remaining of interest payment disadvantage diminishes.
- In 10 years (or one year for the one year bond), with our $1,000, we’ll be able to buy one 10% bond with the return of our $1,000 principal, no matter whether it comes from the 1% bond or the 10% bond. Even original 1% bond holders will get the benefit of higher interest rates then.
At first blush, though, holding bonds as interest rates rise seems to guarantee red ink on your statement if you hold bonds.
The history of total bond returns (interest income plus bond price changes) is somewhat more encouraging. Let’s look at the recent historic relationship between interest rates and total bond returns. For interest rates, we’ll use the 10 Year Treasury Constant Maturity Rate – it’s easily accessible[1] and the news media commonly refer to it when discussing interest rates. For total bond returns, we’ll use the Barclays Aggregate Bond index. For Sensible Financial clients, this is almost certainly the index that their largest single bond fund holding tracks.
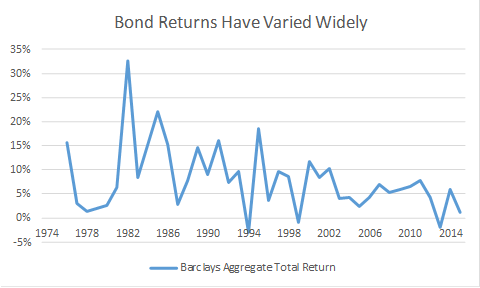 The Barclays Aggregate has had a wide range of total returns over the past 40 years. The graph at left shows the highest return exceeding 32% in 1982, and the minimum return being a loss of almost 3% in 1994. Although we tend to think of bonds as being stable and predictable, it’s wise to remember that while they are much more stable and predictable than stocks, their volatility is not zero! [Also, bond fund returns are more complex than individual bond returns – bond funds hold many bonds with varying maturities. I’m going to ignore this complexity – it would distract us from the basic principles.]
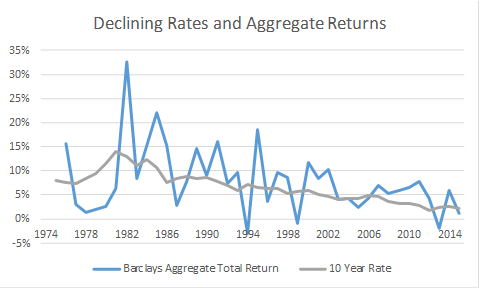
If we overlay the interest rate (the 10 year Treasury constant maturity rate) on the Barclays Aggregate total return, we see that they appear to be related. This suggests that progressively lower interest rates have played an important role in Barclays Aggregate total returns. That is, extended periods of lower interest rates mean lower total returns. However, clearly the interest rate alone is not the whole story.
[Please note that I am not trying to explain Barclays Aggregate returns precisely. Rather, I’m seeking to illustrate conceptually how interest rate levels and changes influence bond fund returns. While the 10 Year is just one of many maturities that the Barclays Aggregate Bond Index tracks, it has the virtue of being both relatively familiar and readily available.]
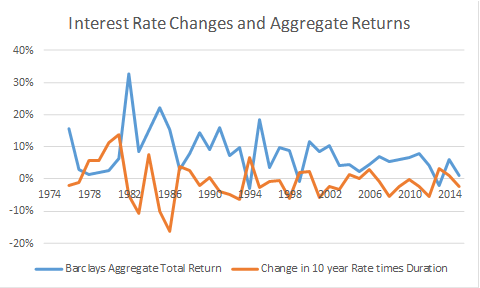 We began this discussion by observing that rising interest rates mean falling bond (fund) prices. Suppose we next try to explain bond total returns with only the change in interest rates. Our next chart (Interest Rate Changes and Aggregate Returns) does just that. It shows the Barclays Aggregate total return with an overlay of the change in the interest rate times -5.6 (in orange). Why minus 5.6? That is the negative of the current “duration” of the Barclays Aggregate Index. Roughly speaking multiplying a bond’s duration by minus its interest rate change estimates the change in the bond’s price we should expect (rising rates go with falling prices and falling rates with rising prices). The patterns in the two paths certainly suggest a relationship, but the Aggregate return is almost always higher. Strikingly, there have been many years of interest rate increases in the last 40 years – the orange curve is very often below the zero line [remember the orange curve is negative when interest rate changes are positive] – but there have been very few years when the Barclays Aggregate had negative total returns. Why is that?
 Suppose we add together the interest rate and the negative of the change in the interest rate times 5.6. (I call this total the Crude Barclays Aggregate estimate). This is the yellow curve in the chart to the left. It adds the gray curve from two charts ago to the orange curve from the last chart. The blue continues to be the Barclays Aggregate Total Return. The yellow curve looks a lot like (well, at least something like) the blue curve. I’d be the last to claim a perfect explanation, but the time paths are quite similar, both shape and level. Adding minus the interest rate change times the duration (5.6 in our case) to the interest rate is a reasonable, albeit far from perfect, explanation for our bond index total return.
In summary, the interest (coupon) we receive from our bond funds can insulate us from the unpleasant price decreases that interest rate increases bring, even if it is not always able to entirely prevent losses. If interest rates rise slowly, and interest rate increases and their negative price effects are small, we would expect funds that track the Barclays Aggregate to deliver positive, even if relatively small, returns. If rates rise rapidly and then level off, we might experience negative bond fund returns for a year, maybe even two, but followed by much more enjoyable positive returns.
If only we could forecast the future path of interest rates. We could sell our bonds and hold cash if we knew that rates were going to rise quickly, then buy bonds again when we knew rates had stopped rising. Alternatively, we would hold our bonds and receive the interest if slow increases were going to occur. Unfortunately, no one can predict how interest rates are going to develop. We can say that if we had sold bonds at the end of 2010, and waited for rates to rise, we’d have missed out on about 17% in bond returns.
We can also say that, even if bond prices do fall rapidly and negative bond returns occur, lenders and savers are still better off. They may regret that they didn’t know in advance how interest rates were going to change. Nevertheless, they will enjoy higher returns and need smaller investments to fund their future spending, and their net positions will improve.
Next time, we’ll talk about how Trump’s policies might intensify the trend toward higher interest rates, and also about real bond returns (returns in terms of purchasing power).
[1] https://fred.stlouisfed.org, DGS10 10-Year Treasury Constant Maturity Rate, Percent, Monthly, Not Seasonally Adjusted
